Transform your Microsoft excel spreadsheet data into powerful interactive maps with Geodata Mapper. Upload CSV or Excel files containing coordinates or postal codes, and instantly visualize locations on a worldwide map.
In today’s data-driven world, location has emerged as one of the most critical dimensions for understanding patterns, making informed decisions, and gaining competitive advantages. The ability to transform raw addresses, postal codes, and coordinates into meaningful visual insights represents a fundamental shift in how organizations approach data analysis.
Full Screen
Geocoding – the process of converting postal codes and addresses into precise geographic coordinates – unlocks the hidden spatial relationships within your data. What appears as simple text in a spreadsheet becomes powerful location intelligence when plotted on a map. This transformation enables businesses to visualize customer distributions, identify service gaps, optimize logistics routes, and discover market opportunities that would otherwise remain invisible in traditional tables and charts.
This GeoData Mapper is a professional web-based tool that converts your spreadsheet data (CSV/Excel files) into interactive maps. Whether you have geographic coordinates or postal codes, you can visualize your data worldwide, apply custom styling, and export in professional formats.
Key Features:
- Support for CSV, XLSX, and XLS files
- Two plotting methods: Direct coordinates or postal code geocoding
- Worldwide geocoding via OpenCage API
- Gradient color styling based on numeric data
- Export to GeoJSON and KMZ with symbology
- 100% browser-based (no data uploaded to servers)
User Guide Step By Step
1-Uploading Your Data
Step 1: Prepare Your File
- File Format: CSV, XLSX, or XLS
- Data Structure:
- Each row represents one location/record
- Columns contain your data fields
- Include headers in the first row
- File Limits: Maximum 100 records, 5MB file size
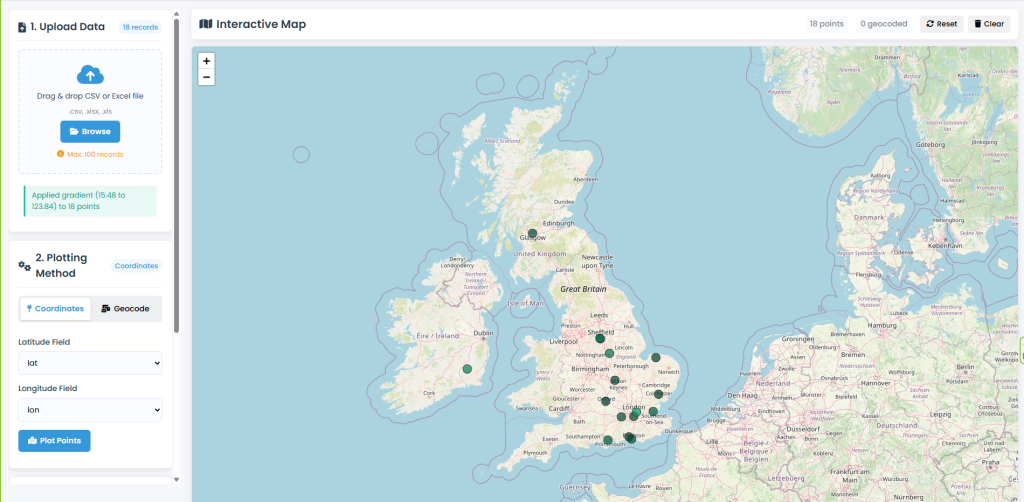
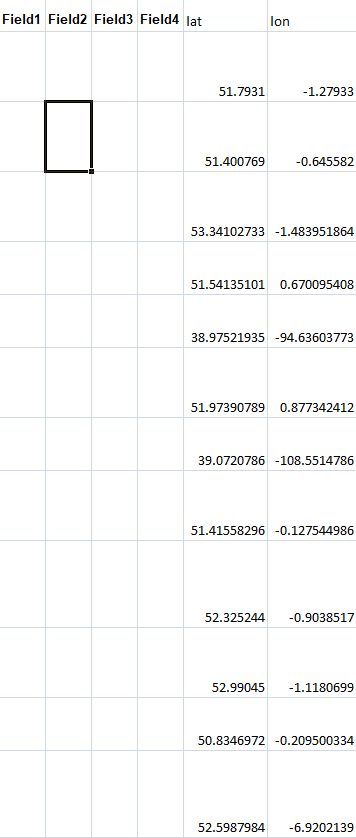
Plotting Latitude Longitude Data on Map
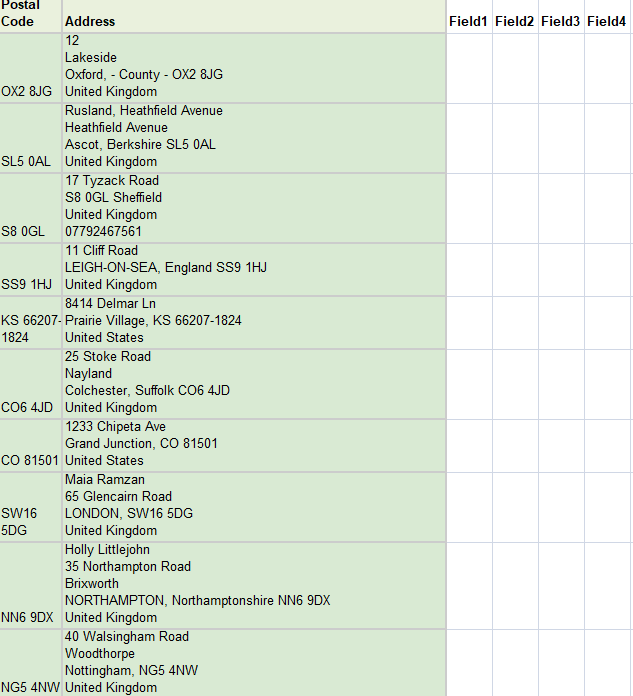
For Geocoding
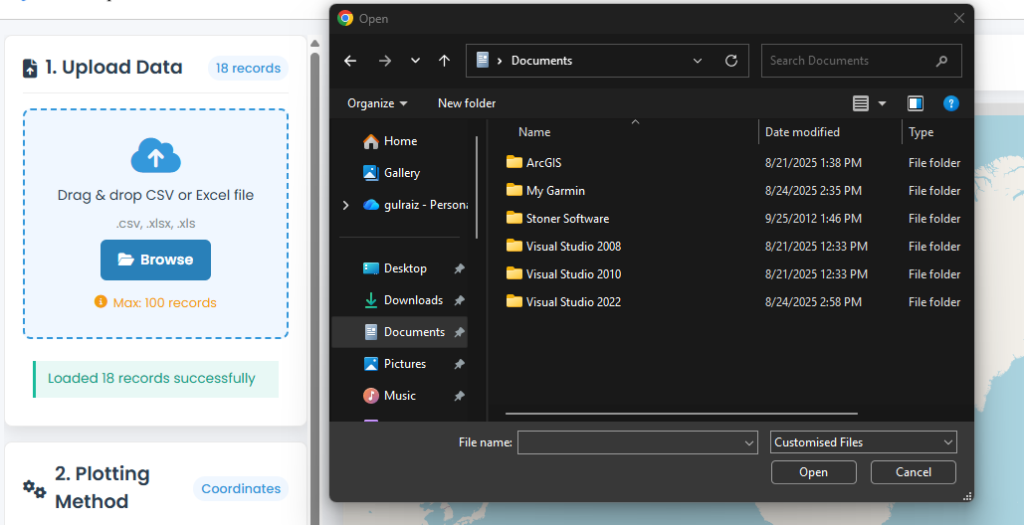
Step 2: Upload Methods
Option A: Drag & Drop
- Locate your file in File Explorer/Finder
- Drag it directly into the “Drag & drop your CSV or Excel file here” area
- Release when the area highlights blue
Option B: Browse
- Click the “Browse Files” button
- Select your file from the dialog
- Click “Open”
Step 3: Verification
- Check the upload status message
- “Success” means your file is ready
- “Error” indicates issues (check file format/size)
2-Plotting Data
Method 1: With Coordinates
Step 1: Select Plotting Method
- Ensure “Coordinates” tab is active (blue background)
- If not, click the “Coordinates” toggle button
Step 2: Select Coordinate Fields
- Latitude Field Dropdown:
- Auto-detection tries common names (lat, latitude, y)
- Or manually select your latitude column
- Longitude Field Dropdown:
- Auto-detection for common names (lon, longitude, x)
- Or manually select your longitude column
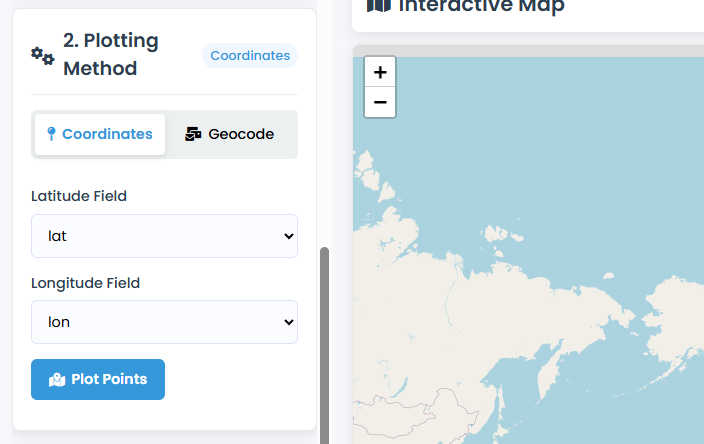
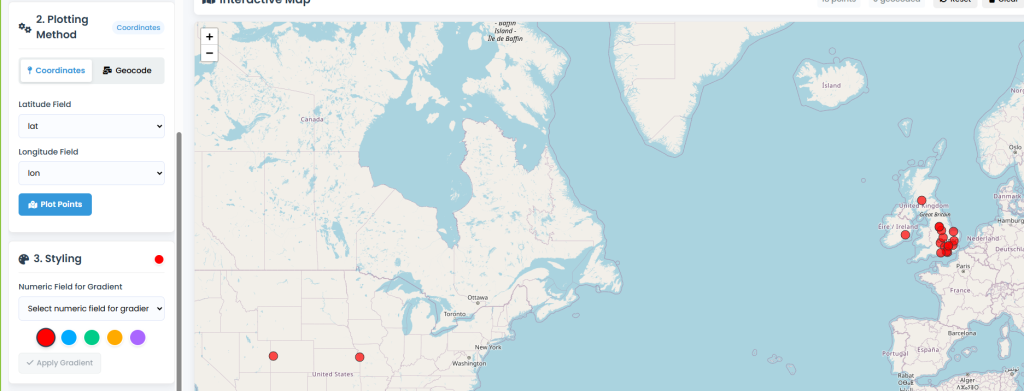
Step 3: Plot Your Data
- Click “Plot Points” button
- Watch points appear on the map
- Results show in status area:
- Success: “Plotted [X] coordinates on map”
- Error: “No valid coordinate data found”
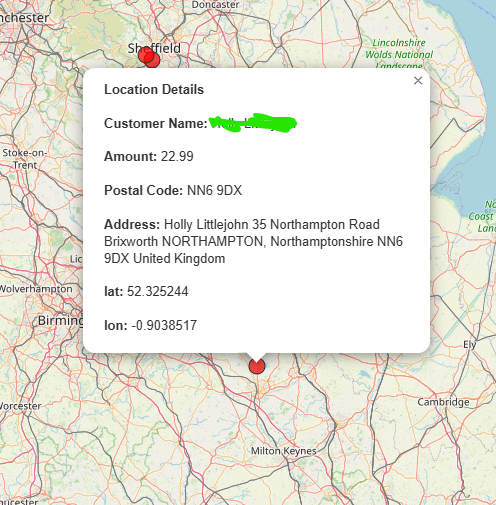
Step 4: Interact with Points
- Zoom: Scroll wheel or +/- buttons
- Pan: Click and drag map
- View Details: Click any point for popup with all data
- Reset View: Click “Reset” button (circular arrow)
Method 2: Geocoding Postal Codes
Use this method to convert addresses or postal codes to map coordinates.
Step 1: Get API Key
- Click the “Get free geocoding API key” link
- Sign up at OpenCageData.com (free: 2,500 requests/day)
- Copy your API key from OpenCage dashboard
Step 2: Select Geocoding Method
- Click the “Geocode” toggle button
- Interface switches to geocoding mode
Step 3: Configure Geocoding
- Enter API Key: Paste your OpenCage key
- Postal Code Field: Select column containing postal codes/addresses
- Country Field (Optional):
- Select column with country names for better accuracy
- Or choose “No country” for worldwide search
Step 4: Start Geocoding
- Click “Start Geocoding” button
- Monitor progress in the progress bar
- Note: 2-second delay between requests (rate limiting)
- Process continues until all records are geocoded
Step 5: Review Results
- Successful geocodes: Appear as points on map
- Failed geocodes: Shown in progress status
- Geocoding quality: Confidence scores in point popups
3. Styling Your Map
Step 1: Select Color Scheme
- Click any color circle to select base color
- Selected color shows in indicator (top-right of section)
Step 2: Apply Gradient Styling (Optional)
- Select Numeric Field: Choose column with numeric values
- Apply Gradient: Click “Apply Gradient” button
- Result: Points color by value (low = light, high = dark)
Step 3: Understanding Gradient Logic
- Lowest value = lightest shade of selected color
- Highest value = darkest shade of selected color
- Values between = proportional color intensity
4. Exporting Results
Available Formats:
- GeoJSON: Standard GIS format, editable in most mapping software
- KMZ with Symbology: Google Earth format with preserved colors/styles
Export Steps:
- Ensure you have plotted points on the map
- Click your preferred export button:
- GeoJSON: For GIS software (QGIS, ArcGIS, etc.)
- KMZ: For Google Earth, with styling included
Export Contents:
Both formats include:
- All your original data fields
- Geographic coordinates
- Applied styling (colors, gradients)
- Popup information structure
Geocoding & Data Visualization: FAQs
1. What exactly is geocoding and why is it important?
Answer: Geocoding is the process of converting addresses (like “123 Main Street, New York, NY 10001”) or postal codes into geographic coordinates (latitude and longitude). It’s crucial because:
- Transforms text to spatial data – Turns addresses into mappable points
- Enables location analysis – Allows businesses to analyze patterns geographically
- Improves decision-making – Helps with site selection, route optimization, and market analysis
- Automates processes – Replaces manual coordinate lookup
- Standardizes location data – Creates consistent geographic references across systems
Think of it as giving every address its “digital fingerprint” on Earth’s surface.
2. What types of businesses or professionals benefit most from mapping tools like this?
Answer: Mapping tools serve diverse industries:
Business & Marketing:
- Retailers – Store location analysis, competitor mapping
- Real Estate – Property value mapping, market heat maps
- Logistics Companies – Route optimization, delivery zone planning
- Marketing Agencies – Customer segmentation by geography
Research & Academia:
- Universities – Social research, environmental studies
- Healthcare – Disease outbreak tracking, hospital accessibility
- Environmental Science – Pollution monitoring, habitat mapping
- Urban Planning – Infrastructure development, zoning analysis
Government & Non-Profit:
- Municipalities – Public service planning, emergency response
- Non-profits – Donor mapping, service area analysis
- Emergency Services – Response time optimization
Individuals & Freelancers:
- Researchers – Field data visualization
- Journalists – Geographic storytelling
- Event Planners – Attendee location mapping
- Small Business Owners – Customer concentration analysis
3. What are the main advantages of visualizing data on maps versus spreadsheets?
Answer: Map visualization offers unique advantages:
Cognitive Benefits:
- Pattern recognition – Spatial patterns emerge instantly (impossible in spreadsheets)
- Faster comprehension – Humans process visual spatial data 60,000x faster than text
- Context understanding – Geographic context provides meaning (proximity, clustering, distribution)
Analytical Advantages:
- Cluster identification – Spot concentrations of customers/incidents
- Gap analysis – Identify underserved areas or market opportunities
- Relationship discovery – See correlations between geography and other variables
- Trend visualization – Watch changes over geographic space
Communication Value:
- Universal understanding – Maps transcend language barriers
- Persuasive presentations – Visual evidence is more compelling
- Stakeholder engagement – Interactive maps engage non-technical audiences
4. What are common use cases for converting spreadsheet data to maps?
Answer: Practical applications include:
Sales & Marketing:
- Customer heat maps – Visualize customer concentration
- Territory management – Assign and balance sales regions
- Competitor analysis – Map competitor locations relative to yours
- Marketing campaign tracking – Geographic response analysis
Operations & Logistics:
- Facility location planning – Optimal placement of warehouses/stores
- Route optimization – Visualize delivery/pickup points
- Service area definition – Define coverage zones
- Asset tracking – Map equipment or vehicle locations
Research & Analysis:
- Survey data mapping – Geographic distribution of responses
- Environmental monitoring – Pollution or resource mapping
- Social research – Demographic pattern visualization
- Risk assessment – Map hazards or vulnerable areas
Personal Applications:
- Travel planning – Plot destinations from trip research
- Genealogy – Map family history locations
- Home buying – Compare property locations
- Event planning – Map attendee locations for venue selection
5. What are the limitations of free geocoding tools versus paid services?
Answer: Key differences:
Free Tools (Like This One):
- ✅ Cost-effective – No upfront investment
- ✅ Easy access – Immediate use, no contracts
- ✅ Low-volume suitable – Perfect for occasional use or small datasets
- ❌ Rate limits – Daily/monthly request caps (e.g., 2,500/day)
- ❌ Slower processing – Delays between requests
- ❌ Basic features – Limited to standard geocoding
- ❌ Accuracy variations – May use lower-quality data sources
Paid Services:
- ✅ Higher limits – Thousands to millions of requests
- ✅ Faster processing – Batch processing, no delays
- ✅ Better accuracy – Premium data sources, regular updates
- ✅ Advanced features – Reverse geocoding, address validation, etc.
- ✅ Support & SLAs – Guaranteed uptime, technical support
- ❌ Cost – Monthly/annual fees
- ❌ Complex setup – May require API integration
Rule of thumb: Free for <100 records/day, occasional use; paid for business-critical, high-volume needs.
6. What should I look for in a good mapping/geocoding tool?
Answer: Essential features for evaluation:
Core Functionality:
- Multiple input formats – CSV, Excel, database connections
- Flexible geocoding – Address, postal code, coordinate support
- Custom styling – Color gradients, size variations, labeling
- Export options – Industry-standard formats (GeoJSON, KML, Shapefile)
Usability Factors:
- Intuitive interface – Minimal learning curve
- Automated field detection – Smart column recognition
- Real-time preview – Immediate visual feedback
- No installation required – Web-based accessibility
Technical Considerations:
- Data privacy – Local processing versus cloud uploads
- Performance – Handling of your typical dataset sizes
- Reliability – Uptime, error handling
- Cost structure – Transparent pricing, free tiers available
Advanced Needs:
- API access – For integration with other systems
- Collaboration features – Team sharing, project management
- Historical data – Time-series mapping capabilities
- Analysis tools – Buffer zones, heat maps, territory creation
7. How do I prepare my data for optimal mapping results?
Answer: Follow this data preparation checklist:
Before Upload:
- Clean addresses – Remove extra spaces, standardize abbreviations
- Separate components – Split address, city, state, zip into separate columns if possible
- Standardize formats – Consistent postal code formatting (with/without spaces)
- Remove duplicates – Eliminate identical addresses
- Validate country codes – Use ISO country codes (US, UK, CA, etc.)
Coordinate Data:
- Use decimal degrees – Not degrees/minutes/seconds
- Verify range validity – Latitude: -90 to 90, Longitude: -180 to 180
- Check precision – 6 decimal places = ~10cm accuracy
Categorical Data:
- Consistent categories – Same spelling/casing for similar items
- Meaningful groupings – Organize data for logical color/symbol assignment
- Complete records – Ensure key fields aren’t missing for visualization
8. What are some creative or unexpected uses for geocoding and mapping tools?
Answer: Beyond traditional uses:
Creative Applications:
- Art installations – Physical representations of geographic data
- Genealogy mapping – Visual family migration patterns
- Literary mapping – Plot locations from novels or historical events
- Music tour visualization – Map concert locations of favorite bands
Personal Life Management:
- Home search optimization – Plot commute times, amenities, schools
- Travel memory mapping – Create visual travel journals
- Family reunion planning – Map relative locations for central venue selection
- House hunting – Combine property listings with neighborhood data
Educational Uses:
- History lessons – Map historical events or migration patterns
- Literature classes – Plot story locations from novels
- Science projects – Visualize environmental data collection
- Language learning – Map countries where language is spoken
Community & Social:
- Neighborhood resources – Map community gardens, libraries, services
- Event impact analysis – Visualize attendance from different areas
- Petition mapping – Show geographic support for causes
- Local business support – Create “shop local” maps
9. How accurate is typical geocoding, and what affects accuracy?
Answer: Accuracy levels vary:
Accuracy Tiers:
- Rooftop precision (1-10m): Exact building location (premium services)
- Street-level (10-50m): Correct street segment
- Postal code centroid (100-1000m): Center of postal code area
- City-level (1-10km): Center of city/town
Factors Affecting Accuracy:
Data Quality Factors:
- Address completeness – Full addresses > postal codes only
- Format standardization – Consistent address formatting
- Country specificity – Country information crucial for international
- Source data quality – Underlying map database accuracy
Geographic Factors:
- Urban vs. rural – Urban areas typically more accurate
- Country variations – Some countries have better address systems
- New developments – Recent construction may not be in databases
Practical Implications:
- Marketing analysis – Postal code accuracy usually sufficient
- Delivery routing – Street-level accuracy needed
- Emergency services – Requires highest precision
- Research purposes – Depends on study scale and requirements
10. What are the next steps after creating my initial map?
Answer: Map creation is just the beginning:
Analysis & Insights:
- Identify patterns – Look for clusters, gaps, or corridors
- Compare layers – If possible, overlay demographic or other data
- Calculate metrics – Distances, densities, or coverage areas
- Time comparisons – Compare with historical data if available
Presentation & Sharing:
- Export for reports – High-resolution images for documents
- Interactive sharing – Web maps for team collaboration
- Presentation integration – Embed in PowerPoint or web presentations
- Print production – For physical displays or publications
Advanced Applications:
- GIS integration – Import into QGIS/ArcGIS for advanced analysis
- Database integration – Connect to business intelligence systems
- API development – Create custom applications using your geocoded data
- Automated updates – Set up recurring mapping for changing data
Professional Development:
- Learn GIS basics – Expand skills with free QGIS tutorials
- Explore advanced visualization – Heat maps, 3D mapping, time series
- Understand spatial analysis – Buffer zones, network analysis, spatial statistics
- Consider certification – GIS professional certifications for career advancement
Remember: Every map tells a story. The value isn’t just in creating the map, but in the insights you derive from it and the decisions it informs. Start simple, learn as you go, and let the geographic patterns guide your understanding.
Open Source Resources